RIGOL MSO5000 Live Monitor (Hacked FW Compatible)

  • 2.3K Views
  • Last Post yesterday
baerndorfer posted this 12 July 2025

Hi all,

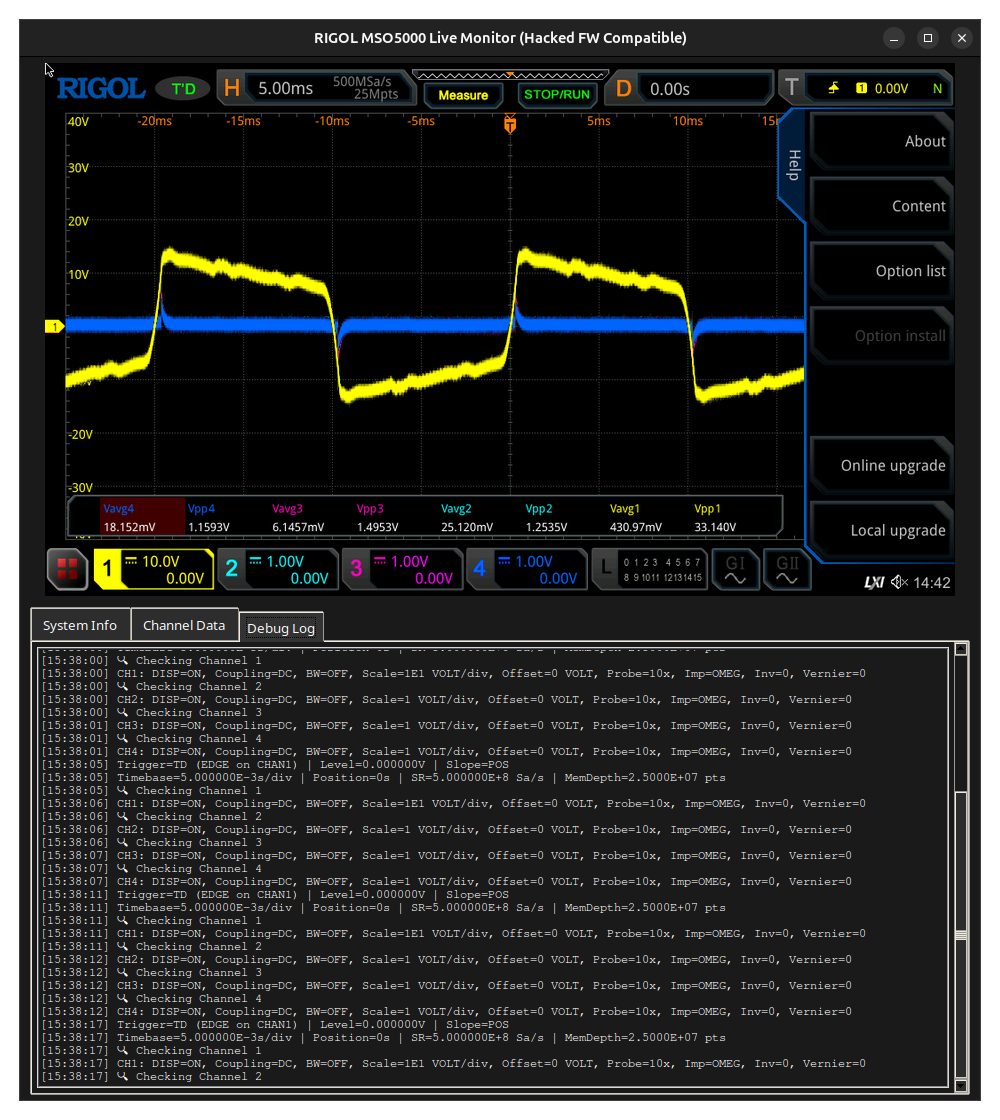
because i was not very satisfied with Web-View from Rigol for my MSO5000 i build my own one.

This tool provides a live view and SCPI-based data extraction from a **Rigol MSO5000** oscilloscope with **hacked firmware** via VNC and VISA (SCPI) interfaces.

The script displays:
- Live screenshots from the oscilloscope (via VNC)
- Channel information including coupling, bandwidth, scale, offset, and probe settings
- Trigger and timebase settings
- Raw waveform statistics (Vpp, Vavg, Vrms) for up to 4 channels
- A scrollable debug log for diagnostics

## Requirements

This script is written in Python 3 and depends on the following libraries:

| Library    | Purpose                            |
|------------|------------------------------------|
| `tkinter`  | GUI interface                      |
| `Pillow`   | Image processing for screenshots   |
| `numpy`    | Numerical processing of waveforms  |
| `pyvisa`   | SCPI communication over TCP/IP     |
| `vncdo`    | VNC client to capture screen image |

### Install dependencies

Make sure you have Python 3 installed, then:

```bash
sudo apt install python3-tk python3-pip
pip3 install pillow numpy pyvisa
sudo apt install vncdo
```

> Note: On Debian/Ubuntu systems, `vncdo` is often available as a package. If not, install it via `pip install vncdo`.

##How to Use

```bash
python3 rigol_vnc_liveview4.py
```

You will be prompted in the terminal to enter the IP address of your RIGOL MSO5000.

Make sure:
- The oscilloscope is on the same network.
- VNC is enabled on the oscilloscope.
- The oscilloscope responds to SCPI commands over TCP/IP.

##Hacked Firmware Notice

This script is optimized to **avoid crashing or hanging** when used with unofficial / hacked firmware:
- Timeouts are reduced
- Some known problematic SCPI queries are skipped or blacklisted after failure

##Screenshot Path

By default, screenshots are saved temporarily at:
```
/tmp/oszi_screenshot.png
```

##Customization

You can adjust these in the script:
- `INTERVALL_BILD`: How often to update the screenshot (seconds)
- `INTERVALL_SCPI`: How often to fetch SCPI data (seconds)
- `WAV_POINTS`: Number of waveform points to request per channel

##License

This project is for **personal use only**. Use at your own risk. Not affiliated with Rigol Technologies.

Attached Files

baerndorfer posted this 5 days ago

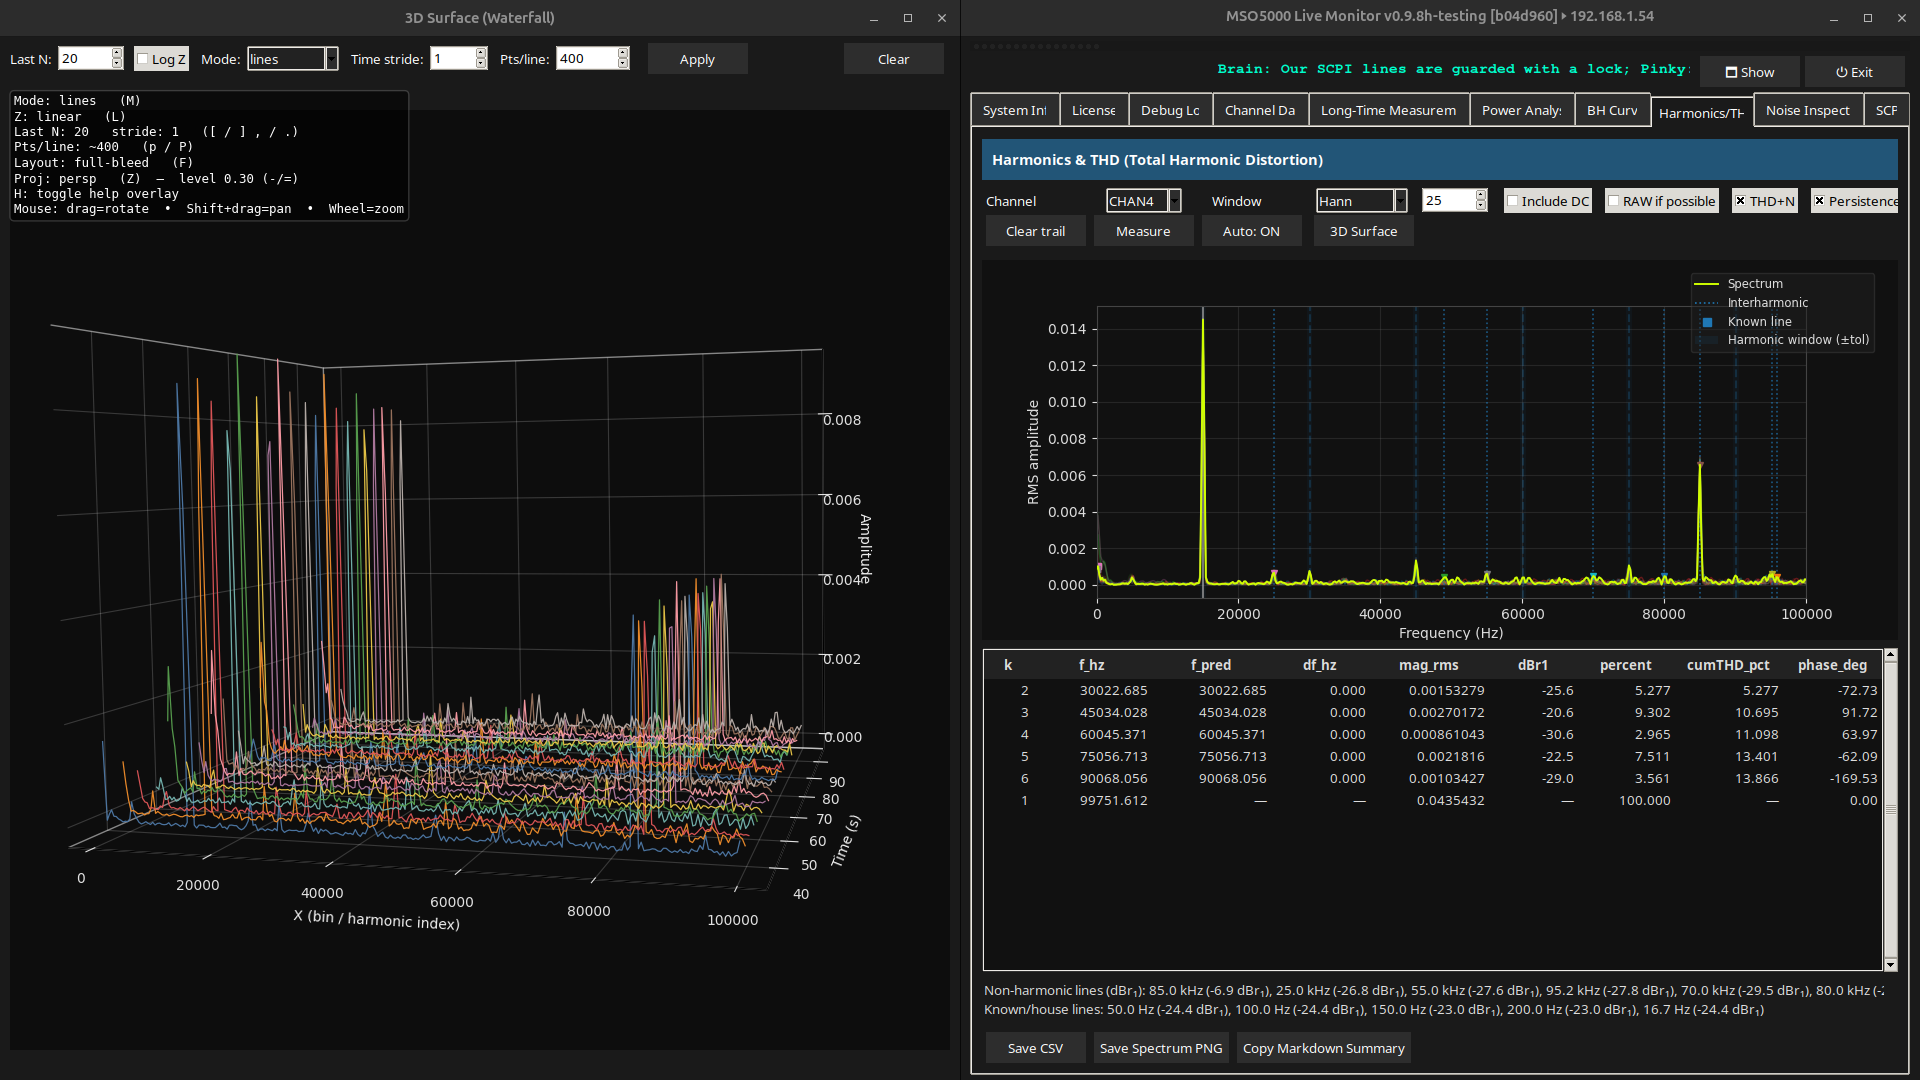
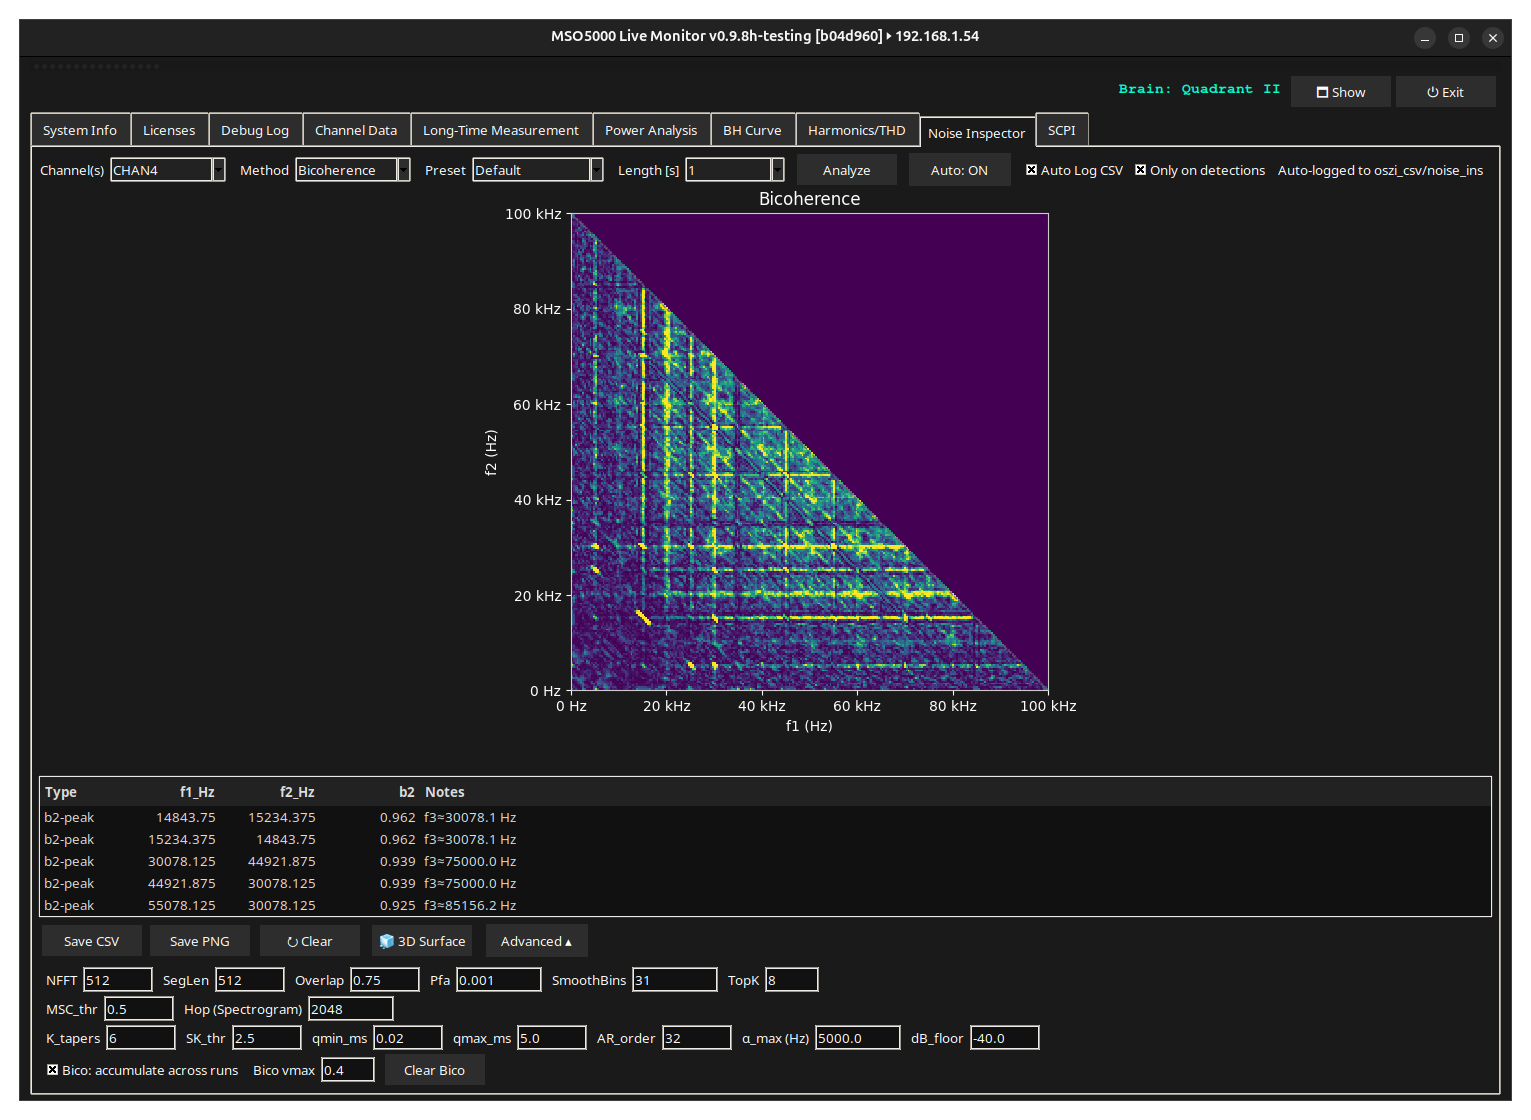
the problem with current is, that in special scenarios i am not able to do a correct measurement. no matter what devices i use the calculated values are not 'logic' for me. power calculation become extremely difficult and therefore i started measuring heat and amount of light which comes from the load. but this is not always practicable and thats why i search for new approaches. while programming this analyzer it becomes obvious that i have to find a way to look into this current which looks more like white noise. to analyze white noise data we have some methods which i can use now to look for things, that stand out of this data. things, that should not be there. very interesting patterns are now visible on my screens. it's funny to watch and give me a better understanding what is realy going on here.

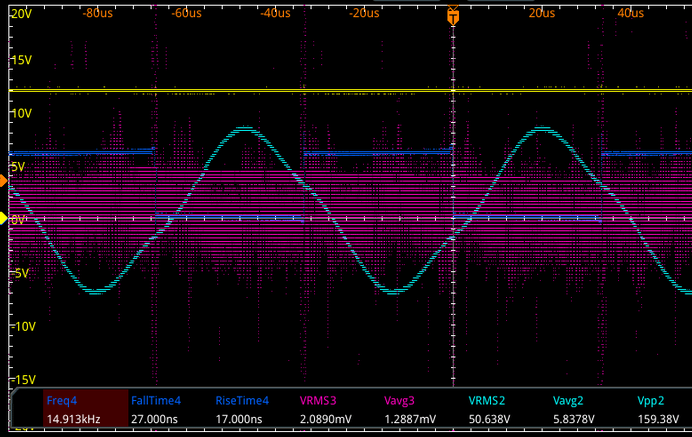
when you take a piece of wire (or coil) and put it on some channel on scope you will see that patterns emerge over time.

very interesting to watch.

this new tool is available on 'testing-branch' - Noise Inspector

regards

B

Fighter posted this 4 days ago

Vey interesting, so the "white noise" actually have embedded in itself obvious patterns.

It's what we also can see in cymatics:


Nothing is really random in the Universe, everything have its own self-resonant frequency.

As my signature says:

"If you want to find the secrets of the universe, think in terms of energy, frequency and vibration."
Nikola Tesla
baerndorfer posted this yesterday

at the moment i do heavy testing with the VEC circuit. i changed the source from dc-power supply to a diode-plug. in combination with VEC the energy exchange between source dipole and VEC is 'white noise'. power analysis on grid shows -12W of negative active power when VEC is in operation. the interesting thing is the current which happen between diode-plug and VEC. i did analysis of this current and there are 2 frequencies that script detects. these 2 frequencies give rise to a third frequency which is dominant and in the MHz region. 
so for my measurement equipment which by the way is not the cheapest one i am not able to measure the exchange between these 2 devices. But i can measure exactly, what i feed in from the grid. and this is power with a mostly reactive component which in my case produce negative active power.

so it's getting more and more interesting.

current is on CH3

i like the analogy which Fighter brought up with the soundwaves

regards
B


Jagau posted this yesterday

Hello Bearndorfer
I'm integrating Linux and Python into another PC. I might be able to follow along.

Jagau

Close